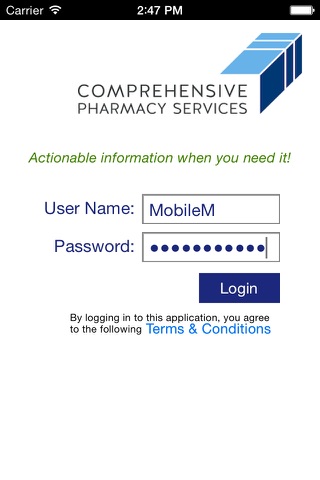
Comprehensive Pharmacy Services Dashboard
General features of Rx-Dashboard are:
· Ability to toggle between facilities with multiple site access
· Double tap – Expands graph view
o Save to photo gallery
o Email directly from smart device
o AirPrint graphics
· Data refreshed every time the user logs in
· Baseline data is displayed as horizontal line for each individual metric
· CPS Benchmark graphed as horizontal line, based on CPS Hospital comparative group:
o Acute beds (CAH, 26-99, 100-299, 300+)
o Specialty designation (Behavioral Health, Clinics, Long Term Acute Care, Rehabilitation, Retail, Skilled Nursing Facility, Specialty Heart, Specialty Ortho)
Tabs of Rx-Dashboard are:
Updates Page
· Provides latest “What’s happening in CPS” with links and display of CPS press releases
· Links to CPS website
· Terms and Conditions
Operations Page
· Customizable dashboards with up to 6 graphs per page (unlimited total-Swipe between pages)
· Based on data input in Operational Metrics platform in Resource Solutions
· Time periods
o Default date
§ Rolls graphs forward each time new metrics are present
o Monthly (2 year max), Quarterly (5 year max), or Annual (5 year max) options
o Based on Hospital Fiscal Year or Calendar Year
· Turn on / off linear trend lines or baseline/benchmark by taping on the legend
Key Indicator Page
· Dashboard representing 4 static key performance metrics (targeting Executive team)
o Drug cost per Census metric (dynamic for each site)
o Clinical Interventions vs. Clinical intervention direct cost savings
o CMI vs. Census metric (dynamic for each site)
o Average Daily Census vs. Average Length of Stay
· Rolling 2 year time period
o Quarterly
o Based on the Hospital Fiscal Year
Clinical Page
· Under final development with pre-defined clinical metrics
· CMS data to compare vs. state and facility clinical performance
Definitions Page
· Provides definitions for all terminology used within the application


